We have finally made one more step on the path to getting our Ajax Grid control out there for .NET!
The Beta 2 has been officially released so go and try it out and let us know what you think!
You can also check out the demo here and it is looking pretty good!
For other perspectives check out the other blogs too: Alexei and Andre.
Posted in AJAX, RIA, Web2.0, asp.net | No Comments » | Add to Delicious | Digg It
We have just made a quick Flex/Ajax dashboard to show how Flex and Ajax can work together to make a very compelling user-interface for something like a corporate information dashboard. You can check it out the demo here and an article about the demo here.
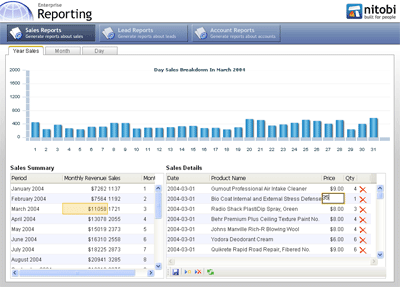
Using the FABridge along with the Nitobi Ajax Grid and Adobe Flex Charting, we have created a scenario where one can view monthly sales data and then see the sales details for the month in both a tabular format in a grid and visually represented in a Flex chart.
Under the hood we have used PHP and MySQL to provide the data to both the data grids and the chart. When a user clicks on a record in the sales data grouped by month, the details grid makes a request to the server for all the sales data for that month - this ends up being between 200 to 1000 records or so. To ensure that the details grid is still fast, we only render the part of the dataset that the user is looking at rather than rendering all 1000 records say, which can take a long time when you use the DOM innerHTML property. The other thing that happens when a month is selected in the master grid is that the Flex chart is also updated with information about the sales for that month, except that the sales data is then grouped by day. Grouping of the sales data could either be done on the client or the server, however, since we have already retreived all the sales data for the month and displayed it in the detail grid we simply take that same data and group it very quickly using an XSL transformation (yes currently only IE and Moz but the latest Safari build also has it - finally!). The grouped data we output from the XSL transformation is actually formatted as JSON which is then evaluated into a JavaScript object and passed to the Flex chart for rendering. The grouping XSLT is pretty simple and uses the Muenchian method:
<xsl:stylesheet version="1.0"

    xmlns:xsl="http://www.w3.org/1999/XSL/Transform" xmlns:ntb="http://www.nitobi.com">

  <xsl:output method="text" encoding="utf-8"/>

  <xsl:key name="sales-by-day" match="ntb:e" use="@h" />

  <xsl:template match="/">

    [<xsl:apply-templates select="//ntb:data" />{}]

  </xsl:template>

  <xsl:template match="ntb:data">

    <xsl:for-each select="ntb:e[count(. | key('sales-by-day', @h)[1]) = 1]">

      {'totalSales': <xsl:value-of select="sum(key('sales-by-day', @h)/@i)"/>,

        'day': <xsl:value-of select="@h" />,

        'month': <xsl:value-of select="@f" />,

        'year': <xsl:value-of select="@g" />},

    </xsl:for-each>

  </xsl:template>

</xsl:stylesheet>
We have also hooked up a few other events so that the chart will be updated when changes to the data in the detail grid are made.
All in all, by using the FABridge to move data to and from a Flex chart we can create very compelling and ultimately very useful dashboard type of application by merrying the Flex and Ajax technologies.
Posted in AJAX, Components, Declarative Programming, Flex, Nitobi, RIA, Web2.0 | 12 Comments » | Add to Delicious | Digg It