Integrating Adobe Flex Charting 2 and Nitobi Grid with FABridge
Written by: Alexei White, Dave Johnson, and Agus Santoso
www.nitobi.com
 As
a developer of Ajax components that make their way into large-scale enterprise
applications, I'm always looking for new ways to visualize enterprise data in a
web application, and bring the user closer to the desktop experience. With the
introduction of the Adobe Flex-Ajax Bridge (FABridge), we have an easy way to
connect our JavaScript-based components like the Nitobi Grid to the powerful
presentation-layer capabilities of Flex. It also means that developers
accustomed to developing with traditional web technologies like PHP, J2EE, and
JavaScript, are able to take advantage of Flex without needing to invest a lot
of up-front time learning the platform.
As
a developer of Ajax components that make their way into large-scale enterprise
applications, I'm always looking for new ways to visualize enterprise data in a
web application, and bring the user closer to the desktop experience. With the
introduction of the Adobe Flex-Ajax Bridge (FABridge), we have an easy way to
connect our JavaScript-based components like the Nitobi Grid to the powerful
presentation-layer capabilities of Flex. It also means that developers
accustomed to developing with traditional web technologies like PHP, J2EE, and
JavaScript, are able to take advantage of Flex without needing to invest a lot
of up-front time learning the platform.
Flex has been a pleasure to learn, chiefly because it borrows a lot from Java, and ECMAScript. Even so, developers using the FABridge can right away start benefiting from the things that Flex and Flash are really good at (not the least of which is Charting, which we'll be looking at here), while not needing to throw out all the existing code in their application. As their comfort level with Flex increases, a world of possibilities opens up for marshalling complex interactions between traditional web apps and Flex.
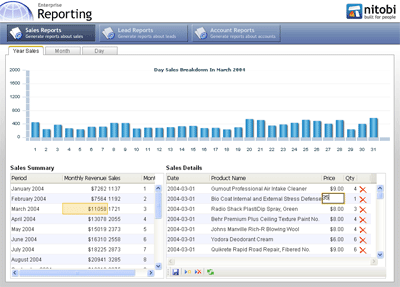
In this demo, the Nitobi Grid, an Ajax component, is used to build an application to review sales data for each month of the year. The FABridge is used to enable the Ajax part of the application to communicate with the Flex Charting component such that the sales data for a selected month can be displayed in a bar chart, offering a dynamic and responsive visualization of our data. All of the sales data is transported from server to the client using Ajax, but subsequently massaged using XSLT and rendered using the FABridge and Flex Charting 2. This approach is particularly attractive since it enables us to preserve the way each tier in our application works as an Ajax application, and simply extend the application to include Flex.
To see this demo in action, click here. (will open in a new window)
Requirements
You should download the Flex 2 SDK (free) and the Flex Builder trial which will allow you compile your own components for use with FABridge. You will also need PHP 4 or 5 to run the back end for the Nitobi Grid. Included in the downloadable version is a trial of the Grid - a full trial can be downloaded here.
Adobe Flex Builder 2
- Try
- Buy
Adobe Flex Charting 2
- Try
- Buy
Adobe Flex-Ajax Bridge
- Download
Flash Player 9
- Download
Nitobi Grid 3.23
PHP 5.1.6
Sample files:
-
nitobiflexdemo.zip (ZIP, 1.3MB)
The nitobiflexdemo.zip file linked at the beginning of this article contains all the tools required to build the sample.
Prerequisite Knowledge:
Familiarity with JavaScript, and PHP. Some understanding of XML and XSLT is nice but not required.
Getting Started
Extract the zipped FABridge file to location of your choice. This will be refered to as FABRIDGE_HOME.
Building the Flex 2 stub application
Since the main point of this tutorial was to take an Ajax application and enhance it with Flex Charting, a major component of this tutorial is the chart itself. To do this one needs to create a new Flex 2 project and import all the classes for Flex Charting. No other coding in the Flex 'stub' is needed. After creating and compiling the stub application we can simply refer to the resulting .swf Flash file in the HTML of the Ajax charting application.
To begin with, open Flex Builder and create a new project for the Charting stub.
Creating a new Flex project:
- Open Adobe Flex Builder 2
- Create a new Flex project -> basic -> ok.
- Use ajaxflex for the project name
- Click finish
Once the Flex project is created the Adobe FABridge source must be added to the project build path.
Adding FABridge to your Flex project:
-
Go to project properties Flex Build Path -> Source Path ->Add Folder
FABRIDGE_HOME\FABridge_B3_05-08\disc\src
After that, the Flex application stub needs to be created, which we can access through the FABridge. In the root "Application" declaration we have included two child elements. The first is a reference to the external script file, which ensures that all the relevant libraries are included in the application and the second is a reference to the FABridge component, which will enable us to talk to the Flex movie from JavaScript.
Create MXML File:
<?xml version="1.0" encoding="utf-8"?>
<mx:Application xmlns:mx="http://www.adobe.com/2006/mxml" xmlns="*" layout="absolute">
  <mx:Script source="ajaxflex.as" />
  <bridge:FABridge xmlns:bridge="bridge.*" />
</mx:Application>
Next, the "ajaxflex.as" file has to be created, which is included in the declaration of the Flex application's MXML file.
Create ActionScript File:
import mx.charts.*;
To create an instance of any given Flex Class from JavaScript, one needs to ensure that the Class name is included in the array variable called refs. For example, to be able to create an instance of a ColumnChart:
public var refs:Array = [ColumnChart]
Since the final compiled .swf file grows as more classes are imported, it is advisable to only add the classes that you need. The final ActionScript file looks something like this:
import mx.core.*; //charts import mx.charts.*; import mx.charts.series.*; import mx.charts.effects.*; import mx.charts.series.items.ColumnSeriesItem;Now the project can be saved, Flex builder should auto-compile the .swf by default, and you should see ajaxflex.swf file in the bin folder right away.
//controls import mx.controls.*;
//mx graphics import mx.graphics.LinearGradient; import mx.graphics.GradientEntry; import mx.graphics.IFill; //utils import flash.utils.Timer; import flash.utils.clearInterval; //effects import mx.effects.*; import mx.effects.easing.*; import mx.effects.effectClasses.*; public var refs:Array = [ //Charts ColumnChart, //Series ColumnSeries, //Axis CategoryAxis, LinearAxis, //Renderer AxisRenderer, //SeriesEffects SeriesSlide, //mx.graphics LinearGradient, GradientEntry, //Controls Label ]
Create a basic Ajax application using Nitobi Grid
With our Flex application stub in hand, we can now look at how to integrate a Flex application into an already existing Ajax application using the FABridge to facilitate the transfer of data between the two. As Flex becomes more popular, the merging of Flex and Ajax applications will likely become increasingly prevalent. In particular, the Flex Charting controls enable one to easily create rich data visualizations in the browser with no need for page refreshes, which fits nicely with the Ajax application paradigm.
The starting point of our web application was a simple interface that used two data grids to display a master-detail relationship of sales data as well as enable editing of the sales details. One of the grids contains information about the months of the year and the total sales for the given month while the other shows the sales details for that month on a sale by sale basis. By clicking on any row of data in the master grid, sales data for that month is loaded in the detail grid using an asynchronous request for the XML data all without a page refresh. To enable this use-case, the Nitobi Grid 3.22 for PHP (although we could just as easily use the ASP or JSP versions) is used, which allows for bi-directional Ajax binding to databases.
Let's look at the steps required to create an Ajax application using the Nitobi Grid.
Basic page setup for Nitobi Grid:- Add xmlns:ntb on the html tag to enable support for custom HTML elements that use the ntb namespace prefix
- Include the grid CSS file which contains a predefined visual skin for the Nitobi Grid
-
Invoke nitobi.initGrids(); to bootstrap the grids. In this
example the initialization is triggered by the body onload event.
<html xmlns:ntb="http://www.nitobi.com">
  <head>
    <link type="text/css" rel="stylesheet" href="styles/nitobi/nitobi.grid.css"/>
  </head>
  <body onload="nitobi.initGrids();">
  <!-- add the grid declaration here-->
  </body>
</html>
-
Nitobi Grid uses a simple declarative XML-based markup to define the
user-interface. This markup sits inline with the rest of the HTML on the page.
The master grid in our samples is specified with the PHP script summary_load_data.php
as the gethandler attribute which will be the source for sales
data. The grid will call this page via an Ajax request to obtain the data that
is displayed in the grid.
<ntb:grid
  id="overviewGrid"
  gethandler="summary_load_data.php"
  width="350"
  height="240"
  mode="livescrolling"
  oncellclickevent="overviewGrid_controller.oncellclick(eventArgs);"
  rowhighlightenabled="true"
  toolbarenabled="false">
  <ntb:columns>
    <ntb:textcolumn label="Period" width="140" xdatafld="Period" editable="false" ></ntb:textcolumn>
    <ntb:numbercolumn label="Monthly Revenue" xdatafld="MonthlyRevenue" editable="false" mask="$###"></ntb:numbercolumn>
    <ntb:textcolumn label="Sales" width="90" xdatafld="SalesCount" editable="false"></ntb:textcolumn>
  </ntb:columns>
</ntb:grid>
In a fashion similar to traditional DOM Events, the oncellclickevent attribute specifies a JavaScript function that will be called when the user clicks on a grid cell. Here the oncellclick function of the overviewGrid_controller object is called and a single argument called eventArgs is passed. The eventArgs argument is a Nitobi Grid specific keyword which is used in cases where the event is specified as a string literal and the user needs to have access to event information such as, in this case, the coordinates of the cell that was clicked in the grid.
The various columns of the Grid are specified using the <ntb:columns> element. The columns collection can contain various data types such as text, number and date. On each defined column the xdatafld attribute specifies which field of the database table is to be displayed in the given column. In this example the first column is a textcolumn and the data to be displayed is the month period for which we have sales data. To achieve that the xdatafld attribute of the column is set to "Period" which corresponds to the database field. Similarly, we declare two more columns to display the total revenue for the month, and the number of sales for the month.
-
Now the second grid is added.
<ntb:grid id="detailGrid" gethandler="detail_load_data.php" savehandler="detail_save_data.php" ondatareadyevent="detailGrid_controller.visualizeData();" height="240" mode="locallivescrolling" width="500" rowhighlightenabled="true" toolbarenabled="true"> <ntb:columns> <ntb:textcolumn label="Date" width="100" xdatafld="OrderDate"></ntb:textcolumn> <ntb:textcolumn label="Product Name" width="255" xdatafld="ProductName"></ntb:textcolumn> <ntb:numbercolumn label="Price" width="50" xdatafld="ProductPrice" mask="$###.##"></ntb:numbercolumn> <ntb:textcolumn label="Qty" width="30" xdatafld="Quantity"></ntb:textcolumn> <ntb:textcolumn label=" " width="30" xdatafld="deleteImgUrl" initial="resources/del.gif"> <ntb:imageeditor></ntb:imageeditor> </ntb:textcolumn> </ntb:columns> </ntb:grid> -
Now the grids are ready. Below is a screenshot of the Ajax portion of our
application so far:
Putting all the pieces together
In order for us to be able to use JavaScript to control and feed data to the Flex chart, we need the Adobe FABridge which provides an easy means to use JavaScript to communicate with the Flex API. We have added the FABridge to the Flex application already but we also need to remember to include the fabridge.js in the HTML page like this:
<script src="resources/bridgesrc/fabridge.js" language="javascript"></script>
Adding the Flex stub on the page.
Now that the grids are on the page and accepting data from the PHP back-end, the Flex Chart application HTML and resources need to be added to the web page like this. This is done using the standard Flash inclusion mechanism with the <object> and <embed> HTML elements.
<object classid="clsid:D27CDB6E-AE6D-11cf-96B8-444553540000"
  id="mybridge"
  width="888"
  height="200"
  codntbse="http://download.macromedia.com/pub/shockwave/cabs/flash/swflash.cab">
  <param name="movie" value="resources/flex.swf" />
  <param name="quality" value="high" />
  <param name= 'flashvars'value='bridgeName=mybridge' />
  <param name="allowScriptAccess" value="sameDomain">
  <param name="bgcolor" value="#ffffff" />
  <embed src="resources/flex.swf"
    quality="high"
    bgcolor="#ffffff"
    width="888"
    height="200"
    name="mybridge"
    align="middle"
    play="true"
    loop="false"
    quality="high"
    flashvars="bridgeName=mybridge"
    allowScriptAccess="sameDomain"
    type="application/x-shockwave-flash"
    pluginspage="http://www.macromedia.com/go/getflashplayer">
  </embed>
</object>
The most important thing to note here is that a variable called bridgeName with the value mybridge is passed to the Flash object using the flashvars parameter. myBridge is the name of the FABridge that will be used to communicate with the Flex application. If a value is not specified for the bridgeName variable, the FABridge will set the value as "flash". This variable is only used by FABridge.as script to be passed back to the FABridge.js in the FABridge__bridgeInitialized method. This parameter is important in that from JavaScript you can access the Flex application object by access the mybridge property of the global FABridge object such as FABridge.mybridge.
So that we don't try to create the Flex Chart before it has loaded, a JavaScript callback method is added to the initialization event of the Flex application.
FABridge.addInitializationCallback("mybridge",init);
In the JavaScript init function we set a flag to signify that the
Flex application has been loaded and is ready to be used.
Create detail grid controller
To respond to various events a controller object is created for both the master and the detail grid. The main responsibility of the detail grid is that once the data has been retrieved from the server and is ready to be rendered, that same data needs to be transformed into a format that can be easily plotted using the Flex Chart. In this case that means the product sales information needs to be grouped and summed by the day as the Chart displays sales data for each day in the month. The OnDataReady event of the detail grid calls the visualizedata() method on the detailGrid_controller object.
var detailGrid_controller = {
  /**
   * Capture the CellClick event on the detail Grid and delete the
   * clicked row if the user clicked on the [x] column.
   */
  deleteRow: function(eventArgs)
  {
    eventArgs.grid.deleteCurrentRow();
  },
  /**
   * VisualizeData is fired on the DataReady event of the detail Grid
   * This will take the sales data from the detail Grid and group sales
   * by day so that it can be summarized visually in the Flex Chart.
   */
  visualizeData: function()
  {
    var overviewGrid = nitobi.getGrid('overviewGrid');
    var detailGrid = nitobi.getGrid('detailGrid');
    // Get the currently selected row in the overviewGrid
    var row = overviewGrid.getSelectedRowObject();
    if (row == null)
    {
      row = overviewGrid.getRowObject(0);
    }
    // Get the month and year information from the currently selected row.
    var month = row.getCell(3).getValue();
    var year = row.getCell(4).getValue();
    // Check if we have actually changed the month or year
    if (month == lastMonth && year == lastYear)
      return;
    lastMonth = month;
    lastYear = year;
    // The Nitobi Grid uses XML data but it is easy to convert the data
    // to another format like JSON using the Nitobi XML library and XSLT.
    // Note: this also performs grouping on the data very efficiently.
    var jsonData = nitobi.xml.transformToString(detailGrid.getDataSource().xmlDoc, nitobi.dataFormatter);
    // Now we have the sales data in JSON format grouped by day
    chart_controller.renderChart(eval(jsonData),month,year);
    // Remove the activity indicator.
    spinner.hide();
  }
}
Create overview grid controller object
Two things need to happen now. First, the detail grid needs to have the data change when a row in the master grid is clicked on. To have the data in the detail grid change due to interactions with the master grid, the gethandler of the detail grid is changed at runtime and the data is re-retrieved from the server. The second thing to do is have the chart update. This task is delegated to the chart controller object as we will see in a moment.
var overviewGrid_controller = {
  /**
   * Oncellclick handles the cell click events in the overview Grid.
   */
  oncellclick: function(eventArgs)
  {
    // Use the event arguments to get the Grid object.
    var overviewGrid = eventArgs.getSource();
    // Get the month and year of the record that was clicked on in the Grid
    var row = eventArgs.getCell().getRow();
    var month = overviewGrid.getCellObject(row,3).getValue();
    var year = overviewGrid.getCellObject(row,4).getValue();
    // Check if we have actually changed the month or year
    if (month == lastMonth && year == lastYear) return;
    // Indicate AJAX activity!
    spinner.show();
    // Set the month and year as filters on the detail Grid
    var detailGrid = nitobi.getGrid("detailGrid");
    detailGrid.getDataSource().setGetHandlerParameter('startMonth',month);
    detailGrid.getDataSource().setGetHandlerParameter('startYear',year);
    // Bind to the new datasource, which will retrieve the new data from the server.
    detailGrid.dataBind();
    return true;
  }
}
When detailGrid.dataBind() is called, the detail grid goes back to the server for more records with the additional querystring parameters 'startMonth' and 'startYear' set by setGetHandlerParameter() method.
Create chart controller objectvar chart_controller = {
flexReady: false,
renderAttempts: 0,
maxRenderAttempts: 100,
chartCreated: false,
/**
* Renders the given data in the Flex Chart and updates the Chart title
*/
renderChart: function(chartData, targetMonth, targetYear)
{
if (!this.flexReady)
{
if (this.renderAttempts < this.maxRenderAttempts)
{
window.setTimeout(function() {chart_controller.renderChart(chartData, targetMonth, targetYear);}, 50);
this.renderAttempts ++;
}
return;
}
if (!this.chartCreated)
{
// Create the Chart using our Flex Charting method.
nitobi.CreateChart(FABridge, 'mybridge', 'chart1', chartData);
this.chartCreated = true;
}
this.updateChartData(FABridge, 'mybridge', 'chart1', chartData);
// Update the chart title
var title = FABridge['mybridge'].root().getChildByName("title");
title.setText("Day Sales Breakdown In " + getMonthName(targetMonth) + " " + targetYear);
},
/**
* Update the Flex Chart with a new DataProvider.
* The chartData is in an ECMAScript arrary of structs [{totalSales:100,month:4,year:2004}]
*/
updateChartData: function (FABridge, bridgeName, chartName, chartData)
{
// Get the Root of our Flex application and find our Chart
var root = FABridge[bridgeName].root();
var chart = root.getChildByName(chartName);
// Change the DataProvider property
chart.set("dataProvider",chartData);
chart.get("horizontalAxis").set("dataProvider",chartData);
}
}
With all of the sales data on the client for the a given month, we are ready to immediately render this data in both the detail Nitobi Grid as well as the Flex Chart. However, the data in the detail grid is in XML format and contains the details of every single sale. To plot the daily sales summary in the chart we want the data to be summed for each day and formatted as JavaScript objects rather than XML data. To achieve this, the Nitobi JavaScript XML library is used to transform the sales details into summarized sales data per day in JSON format. Performing operations such as sorting, grouping, and filter of large amounts of data is ideally suited to XML and XSLT rather than native JavaScript. After transforming the data with a simple XML Stylesheet (XSLT), the JSON formatted data is then evaluated to return an array of data objects containing total sales data for each day of the month. Conveniently, native JavaScript arrays can be seamlessly passed to the Flex ChartObject instance (notice that the dataProvider property is changed in the updateChartData function) because this array of hashes is the same as ArrayCollection object in ActionScript.
Some JSON data that is passed to the Flex Chart might look like this:
[{totalSales:303,day:1,month:1,year:2004},{totalSales:262,day:2,month:1,year:2004},...]
Creating a Flex column chart through FABridge
Having covered most of the Ajax side of the application, the next step is to get the JSON formatted data to render in the chart; this, of course, is achieved using the FABridge. The way FABridge works is that it keeps track both Flex objects and JavaScript Flex facade objects in a hash. The bridge object can be accessed like this:
bridgeObj = FABridge['mybridge'];To access the root level of the flash movie the root() method is used:
flexApp = bridgeObj.root();
In Flex, calling the root method of the bridge object gives us the top level Application container object as we see in the MXML file. Once there is a handle to the Application element child objects can be added to the container as we will see soon.
Creating an instance of a Flex class through the FABridge is just a matter of calling the create() method with the full name of the class is that is to be instantiated. The Flex Chart can be created in the following way:
var chart =  bridgeObj.create("mx.charts.ColumnChart");
set(chart,{'x':0,'y':0,'name':chartName ,'dataTipFunction': formatDataTip, 'showDataTips':true,
           'dataTipMode':'multiple','width':chartDim.width,'height':chartDim.height});
The set method is a custom helper function that we have created and is used to set several properties of any Flex object at once, but you can always explicitly call the setStyle() method or the set() method of the object like this:
chart.set("x",0);
chart.setStyle("fontSize",12);
It is important to differentiate between properties and styles because it is a common mistake to use the set() method to set a style which only works for setting a property, and vice versa. This error will run silently under Firefox, but the Flash player in IE will throw a popup when it is encountered.
After creating the chart object and setting all the properties on it, the Chart now needs a data series to display. Again, using the FABridge, a new ColumnSeries object is created:
var s1 = bridgeObj.create("mx.charts.series.ColumnSeries");
set(s1,{'yField':'totalSales'});
Here the yField property is set to totalSales. This is the name of a field in the chart data which is passed to the chart from JavaScript. To keep things visually stimulating, we can even create a transition effect for the series that will make it obvious to the end user that the chart data has been updated. To make the series to slide from the bottom upward when the chart data gets updated is a simple matter:
var slide1 = bridgeObj.create("mx.charts.effects.SeriesSlide");
set(slide1,{'duration':400,'direction':'down','elementOffset':0,'offset':0});
var slide2 = bridgeObj.create("mx.charts.effects.SeriesSlide");
set(slide2,{'duration':200,'direction':'up','elementOffset':0,'offset':0});
setStyle(s1,{"hideDataEffect":slide1,'showDataEffect':slide2});
The setElementOffset denotes the delay between the start of an effect between a series element, and setOffset denotes the starting delay of the effect after the initial triggering event. The triggering event for slide1 is the showDataEffect event and for slide2 it is the hideDataEffect event.
Finally, the chart is added to the top level Application container using the addChild() method:
flexApp.addChild(chart);
Here is the final code for creating the column chart in the sample, this one is a little bit more complicated but essentially the same as what we just went over.
function CreateChart(FABridge,bridgeName,chartName,chartData)
{
  bridgeObj = FABridge[bridgeName];
  flexApp = bridgeObj.root();
  var chart =  bridgeObj.create("mx.charts.ColumnChart");
  set(chart,{'x':0,'y':0,'name':chartName ,'dataTipFunction': formatDataTip, 'showDataTips':true,
             'dataTipMode':'multiple','width':chartDim.width,'height':chartDim.height});

  var s1 = bridgeObj.create("mx.charts.series.ColumnSeries");
  //begin section: setup transition effect on the series
  var slide1 = bridgeObj.create("mx.charts.effects.SeriesSlide");
  set(slide1,{'duration':400,'direction':'down','elementOffset':0,'offset':0});
  var slide2 = bridgeObj.create("mx.charts.effects.SeriesSlide");
  set(slide2,{'duration':200,'direction':'up','elementOffset':0,'offset':0});
  //Note: setElementOffset denotes the delay between the start of an effect between two series.
  //Note: setOffset denotes the delay of the start of the effect overall after the initial trigger.
  set(s1,{'yField':'totalSales'});
  setStyle(s1,{"hideDataEffect":slide1,'showDataEffect':slide2});
  //end section.
  //begin section: customize the look and feel of the series.
  var linGrad = bridgeObj.create("mx.graphics.LinearGradient");//linear gradient
  var gradEntries = new Array();
  for(var i=0; i<colorSchemes[csi]["color"].length; i++){
    var gradEntry = bridgeObj.create("mx.graphics.GradientEntry");
    set(gradEntry,{'ratio':colorSchemes[csi]["ratio"][i],'color':colorSchemes[csi]["color"][i]});
    gradEntries.push(gradEntry);
  }
  set(linGrad,{'angle':0,'entries':gradEntries});
  //Note: entries is not listed as a property in the official Flex 2 docs, its in the sample.
  setStyle(s1,{'fill':linGrad});
  //end section.
  //add series to chart
  set(chart,{'series':[s1]});
   //begin section: sets up chart title
  var title = FABridge.mybridge.create("mx.controls.Label");
  set(title,{'name':'title','text':'Day Sales Breakdown In','width':chartDim.width});
  setStyle(title,{'textAlign':'center','fontWeight':'bold'});
  //end section.
  //begin section: create horizontal category axis. i.e: the x-axis ticks value
  //Note: categoryAxis is for string ticks value
  //Note: linearAxis is for number ticks value
  var catXAxis = FABridge.mybridge.create("mx.charts.CategoryAxis");
  catXAxis.setDisplayName("Day"); //set name so I can retrieve later
  catXAxis.setDataProvider(chartData);// set the date source
  catXAxis.setCategoryField("day");//set the lookup field name in data source
  chart.setHorizontalAxis(catXAxis);//apply axis to chart object
  //end section.
  //begin section: create vertical axis
  var verYAxis = FABridge.mybridge.create("mx.charts.LinearAxis");
  set(verYAxis,{'displayName':'sales','minimum':0,'maximum':2000,'autoAdjust':false});
  chart.setVerticalAxis(verYAxis);
  //end section.
  //add all objects to the flex app
  flexApp.addChild(title);
  flexApp.addChild(chart);
}
Now, when the user clicks on a row in the master grid, the details grid displays the sales for that month, and the chart is updated too. We also see a nice animation effect when the data in the chart changes, indicating to the user that there has been a change.
Overall, it was straightforward to wire up our chart with data using JavaScript. FABridge made it easy to extend my Ajax application by allowing me to maintain my Ajax transport method for Data and my PHP-based data tier. By using the bridge to distribute the workload between JavaScript/DHTML, and Flash, we get the best of both worlds. It's easy to see how this will open up possibilities for improving existing business applications with robust visualizations using not only the Flex Charting tools, but also the native drawing libraries, E4X features, and high-speed computation which is afforded by the greatly improved Flash 9 player.
Where to go from here:
For more information on FABridge, you can go to Adobe Labs. The Nitobi Grid used in this demo can be downloaded for free right here
Alexei and Dave are both available for any other questions that readers may have.